arrow
arrow
arrow
Study the given bar-graph and answer question that follows.The bar-graph depicts the number of policies purchased in May, June, July and August.T
Question

Study the given bar-graph and answer question that follows.

The bar-graph depicts the number of policies purchased in May, June, July and August.

The number of policies purchased in July increased by approximately what per cent as compared to June?

A.

40%

B.

33%

C.

75%

D.

66%

Correct option is B

Given:

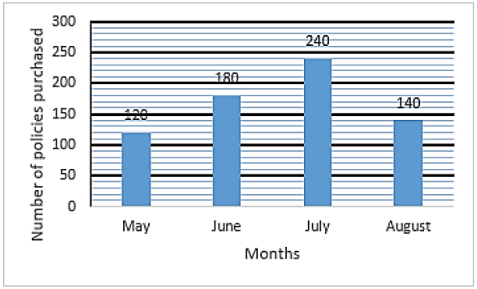
The number of policies purchased in May, June, July and August

Solution:

Number of policies purchased in July = 240

Number of policies purchased in June = 180

Number of policies purchased in July more than June = 240 -180 = 60

Percentage of policies purchased in July more than June =60180×100=1003%=3313% \frac{60}{180} \times 100 = \frac{100}{3} \% =33\frac{1}{3}\% 

Thus, option (b) 33% is correct

Free Tests

Free
Must Attempt

CBT-1 Full Mock Test 1

languageIcon English
  • pdpQsnIcon100 Questions
  • pdpsheetsIcon100 Marks
  • timerIcon90 Mins
languageIcon English
Free
Must Attempt

RRB NTPC Graduate Level PYP (Held on 5 Jun 2025 S1)

languageIcon English
  • pdpQsnIcon100 Questions
  • pdpsheetsIcon100 Marks
  • timerIcon90 Mins
languageIcon English
Free
Must Attempt

CBT-1 General Awareness Section Test 1

languageIcon English
  • pdpQsnIcon40 Questions
  • pdpsheetsIcon30 Marks
  • timerIcon25 Mins
languageIcon English

Similar Questions

test-prime-package

Access ‘RRB Group D’ Mock Tests with

  • 60000+ Mocks and Previous Year Papers
  • Unlimited Re-Attempts
  • Personalised Report Card
  • 500% Refund on Final Selection
  • Largest Community
students-icon
354k+ students have already unlocked exclusive benefits with Test Prime!
Our Plans
Monthsup-arrow