arrow
arrow
arrow
Observe the graph and answer the question given below. The bar graph represents a company's data about the number of employees hired, promoted and
Question

Observe the graph and answer the question given below.
The bar graph represents a company's data about the number of employees hired, promoted and fired.

Assume there was no change in employee numbers other than the Hire and Fire data provided above.
If the Employee strength in the company was 500 employees in 2001, what would be the approximate difference in the employees promoted, as a percentage of employee strength, for the years 2001 and 2004.

A.

8%

B.

15%

C.

3%

D.

5%

Correct option is C

Solution:
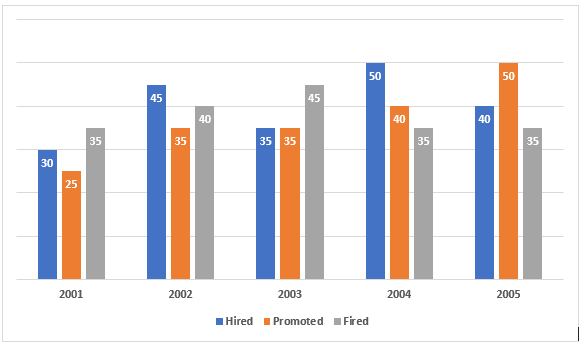
Number of employees promoted in 2001 = 25
Number of employees promoted in 2004 = 40
Difference = 40 - 25 = 15
Now
​we calculate the percentage of promoted employees based on the employee strength in 2001 (500 employees).
So,
Required % =15500×100\frac{15}{500}\times 100​​
=> 3%

Free Tests

Free
Must Attempt

CBT-1 Full Mock Test 1

languageIcon English
  • pdpQsnIcon100 Questions
  • pdpsheetsIcon100 Marks
  • timerIcon90 Mins
languageIcon English
Free
Must Attempt

RRB NTPC Graduate Level PYP (Held on 5 Jun 2025 S1)

languageIcon English
  • pdpQsnIcon100 Questions
  • pdpsheetsIcon100 Marks
  • timerIcon90 Mins
languageIcon English
Free
Must Attempt

CBT-1 General Awareness Section Test 1

languageIcon English
  • pdpQsnIcon40 Questions
  • pdpsheetsIcon30 Marks
  • timerIcon25 Mins
languageIcon English

Similar Questions

test-prime-package

Access ‘RRB NTPC’ Mock Tests with

  • 60000+ Mocks and Previous Year Papers
  • Unlimited Re-Attempts
  • Personalised Report Card
  • 500% Refund on Final Selection
  • Largest Community
students-icon
353k+ students have already unlocked exclusive benefits with Test Prime!
Our Plans
Monthsup-arrow