arrow
arrow
arrow
Observe the graph and answer the question given below. The bar graph represents a company's data about the number of employees hired, promoted and
Question

Observe the graph and answer the question given below.
The bar graph represents a company's data about the number of employees hired, promoted and fired.

What is the ratio of the average number of employees hired during 2003-2005 to that of those promoted?

A.

3:1

B.

1:1

C.

1:2

D.

2:1

Correct option is B

Solution:

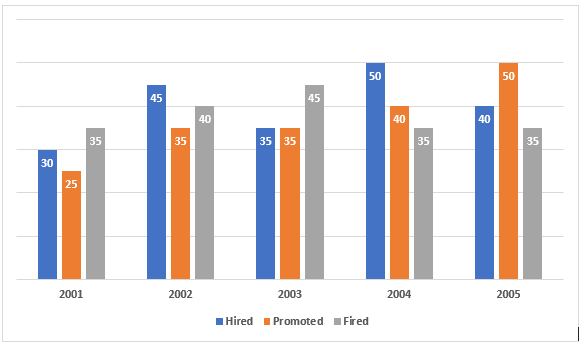
Total of the number of employees hired during 2003 - 2005 = 35 + 50 + 40 = 125

Average of the number of employees hired during 2003 - 2005 = 125/3
Total of the number of employees promoted during 2003 - 2005

= 35 + 40 + 50 = 125

Average of the number of employees promoted during 2003 - 2005 = 125/3
Ratio = 125/3 : 125/3 =  1 : 1

Free Tests

Free
Must Attempt

CBT-1 Full Mock Test 1

languageIcon English
  • pdpQsnIcon100 Questions
  • pdpsheetsIcon100 Marks
  • timerIcon90 Mins
languageIcon English
Free
Must Attempt

RRB NTPC Graduate Level PYP (Held on 5 Jun 2025 S1)

languageIcon English
  • pdpQsnIcon100 Questions
  • pdpsheetsIcon100 Marks
  • timerIcon90 Mins
languageIcon English
Free
Must Attempt

CBT-1 General Awareness Section Test 1

languageIcon English
  • pdpQsnIcon40 Questions
  • pdpsheetsIcon30 Marks
  • timerIcon25 Mins
languageIcon English

Similar Questions

test-prime-package

Access ‘RRB NTPC’ Mock Tests with

  • 60000+ Mocks and Previous Year Papers
  • Unlimited Re-Attempts
  • Personalised Report Card
  • 500% Refund on Final Selection
  • Largest Community
students-icon
354k+ students have already unlocked exclusive benefits with Test Prime!
Our Plans
Monthsup-arrow