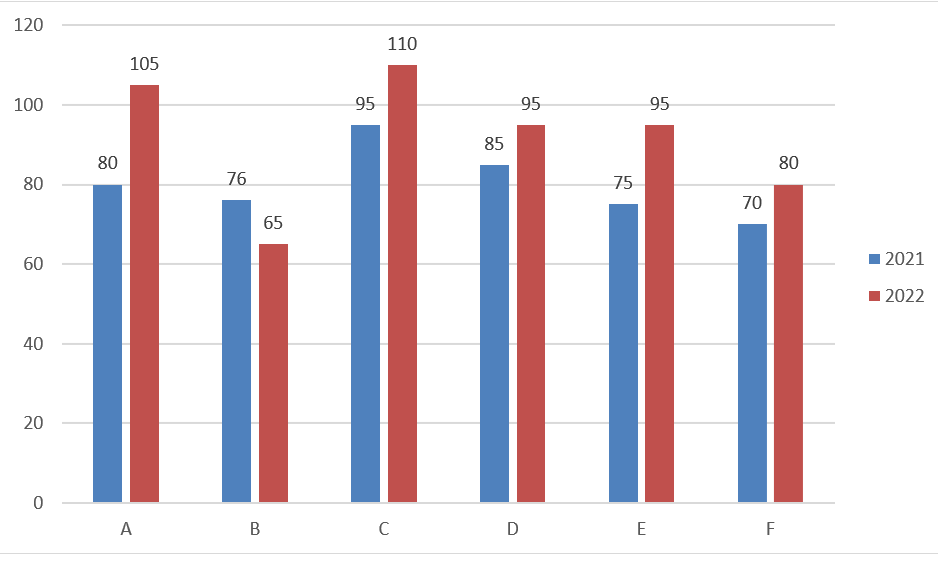
arrow
arrow
arrow
Observe the given bar graph and answer the question.The bar graph shows the sales of computers (in thousands) from five different shops S1, S2, S3, S4
Question

Observe the given bar graph and answer the question.

The bar graph shows the sales of computers (in thousands) from five different shops S1, S2, S3, S4 and S5 for the years 2017 and 2018.

Which of the following statements is true?

A.

Total combined Sales for all shops in 2018 is lower than in 2017

B.

Total combined Sales for all shops in 2018 is higher than in 2017

C.

Four shops recorded higher sales in 2018 as compared to 2017

D.

Total combined Sales for all shops in 2018 is the same as that in 2017

Correct option is D

Given:

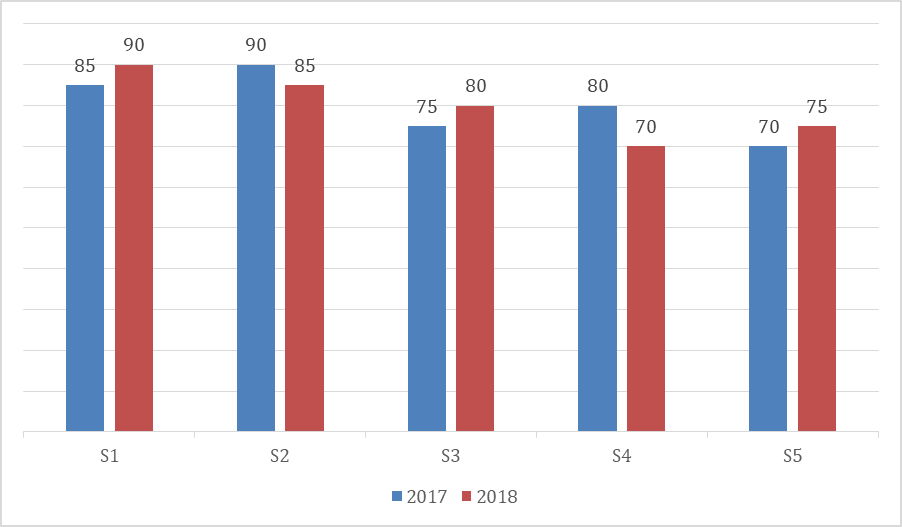
Sales data (in thousands) from shops S1 to S5 for 2017 and 2018.

Solution:
2017 Sales:
S1 = 85, S2 = 90, S3 = 75, S4 = 80, S5 = 70

Total 2017= 85 + 90 + 75 + 80 + 70 = 400

2018 Sales:
S1 = 90, S2 = 85, S3 = 80, S4 = 70, S5 = 75

Total 2018 = 90 + 85 + 80 + 70 + 75 = 400

Since totals are equal,
Correct Answer: D — Total combined Sales for all shops in 2018 is the same as that in 2017.

Free Tests

Free
Must Attempt

CBT-1 Full Mock Test 1

languageIcon English
  • pdpQsnIcon100 Questions
  • pdpsheetsIcon100 Marks
  • timerIcon90 Mins
languageIcon English
Free
Must Attempt

RRB NTPC Graduate Level PYP (Held on 5 Jun 2025 S1)

languageIcon English
  • pdpQsnIcon100 Questions
  • pdpsheetsIcon100 Marks
  • timerIcon90 Mins
languageIcon English
Free
Must Attempt

CBT-1 General Awareness Section Test 1

languageIcon English
  • pdpQsnIcon40 Questions
  • pdpsheetsIcon30 Marks
  • timerIcon25 Mins
languageIcon English

Similar Questions

test-prime-package

Access ‘RRB NTPC’ Mock Tests with

  • 60000+ Mocks and Previous Year Papers
  • Unlimited Re-Attempts
  • Personalised Report Card
  • 500% Refund on Final Selection
  • Largest Community
students-icon
354k+ students have already unlocked exclusive benefits with Test Prime!
Our Plans
Monthsup-arrow