


Correct option is C
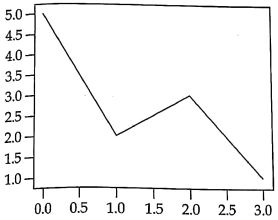
To plot the data as a line plot, the appropriate function in Matplotlib is pl.plot(). This function is used to plot continuous data points connected by lines, as seen in the graph you provided.
Code Explanation:
The correct code will be:
import matplotlib.pyplot as pl
pl.plot([5, 2, 3, 1])
pl.show()
Important Key Points:
1.
pl.plot(): This function is used to plot a line graph, which connects data points with a continuous line.
2.
pl.show(): This displays the plot to the screen.
3.
Line Plot: In the given graph, the points are connected by a line, making pl.plot() the correct function to use.
Knowledge Booster:
·
Option (a):
pl.bar([5, 2, 3, 1]) would create a bar graph, not a line graph. It does not match the structure of the given graph.
·
Option (b):
pl.scatter([5, 2, 3, 1]) would create a scatter plot, where individual points are plotted without connecting lines. This is not what is shown in the given graph.
·
Option (d):
pl.line([5, 2, 3, 1]) is not a valid function in Matplotlib. The correct function to create a line plot is pl.plot().
 English
 150 Questions
 150 Marks
 150 Mins
