


Correct option is A
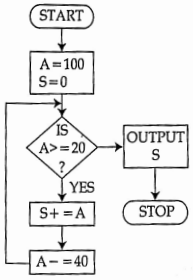
The flowchart initializes two variables: A = 100 and S = 0. The program then checks the condition A ≥ 20 and performs a loop until the condition becomes false. In each iteration, the value of A is added to S, and then A is decreased by 40.
Step-by-step working:
Initial values:
A = 100, S = 0
Iteration 1:
Condition check → 100 ≥ 20 → TRUE
S = S + A → S = 0 + 100 = 100
A = A − 40 → A = 60
Iteration 2:
Condition check → 60 ≥ 20 → TRUE
S = S + A → S = 100 + 60 = 160
A = A − 40 → A = 20
Iteration 3:
Condition check → 20 ≥ 20 → TRUE
S = S + A → S = 160 + 20 = 180
A = A − 40 → A = -20
Next condition check → -20 ≥ 20 → FALSE
The loop terminates and the program displays the value of S.
Therefore, the final OUTPUT S = 180.
Important Key Points:
- The flowchart initializes variables as A = 100 and S = 0.
- The loop continues while the condition A ≥ 20 remains true.
- In each iteration, A is added to S, and then A decreases by 40.
- The loop stops when A becomes less than 20, and the final value of S is printed.
Knowledge Booster:
- 120: This value would occur only if the loop executed incorrectly or skipped one iteration, which does not follow the flowchart logic.
- 100: This represents only the first iteration result (S = 100) and ignores the remaining valid iterations.
- 160: This value appears after the second iteration, but the condition 20 ≥ 20 is still true, so one more iteration must occur before termination.
 English
 150 Questions
 150 Marks
 150 Mins
