


Correct option is B
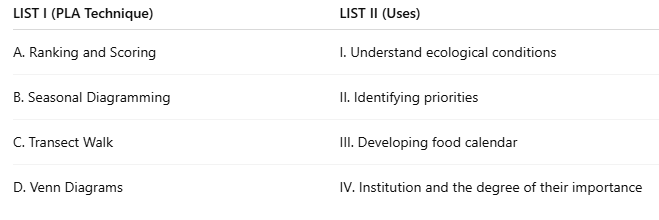
Ranking and Scoring (A) This technique helps communities or groups prioritize issues, resources, or problems by assigning ranks or scores based on their importance or urgency. For example, villagers might rank different crops based on profitability or difficulty to grow. This process encourages participatory decision-making, ensuring that the community’s most pressing needs are addressed first. Thus, ranking and scoring are used for
identifying priorities (II).
Seasonal Diagramming (B) Seasonal diagrams illustrate patterns and cycles over time, such as food availability, rainfall, disease outbreaks, or labor demand. By mapping these seasonal variations on a calendar, communities and planners can better understand and anticipate changes. For instance, a seasonal food calendar can show periods of scarcity and abundance, helping in resource planning and intervention. Hence, seasonal diagramming is used for
developing food calendars (III).
Transect Walk (C) A transect walk involves community members and facilitators walking along a defined path (transect) through the village or environment to observe, discuss, and document ecological, social, and infrastructural features. This technique helps in gaining a first-hand understanding of environmental conditions, land use, water sources, vegetation, and problem areas. It encourages community participation in assessing their own environment. Therefore, transect walk is used to
understand ecological conditions (I).
Venn Diagrams (D) Venn diagrams are visual tools that map relationships among different institutions, groups, or organizations within a community. Circles represent groups or institutions, and their size indicates importance or influence, while overlaps show cooperation or shared functions. This technique helps communities recognize key stakeholders and their roles, useful for planning and collaboration. Thus, Venn diagrams are used for
showing institutions and the degree of their importance (IV).
Information Booster
PLA techniques emphasize community involvement and local knowledge, making development programs more relevant and sustainable.
· Ranking and scoring allow communities to voice their preferences democratically.
· Seasonal diagramming connects planning to real-life cyclical events affecting livelihoods.
· Transect walks provide direct observation and discussion, deepening understanding beyond surveys.
· Venn diagrams clarify social dynamics, aiding in coalition building and conflict resolution.
 English
 10 Questions
 20 Marks
 12 Mins
