Correct option is A


 English
 100 Questions
 200 Marks
 60 Mins English English25 Questions50 Marks15 Mins English English100 Questions200 Marks60 Mins English
Study the following histogram and answer the question :

(Note: The number of lamps is a multiple of 5)
The difference between the total number of neon lamps whose life time is 400 hours or more but less than 700 hours and the total number of neon lamps whose life time is 900 hours or more is t. The value of t lies between :
Study the following graph and answer the question given below.Imports and exports of a country during 2020 to 2024

By what percent is the total imports of the country during 2022 and 2023 less than the total exports during2020, 2021 and 2024?
Study the given graph carefully and answer the given question.
The graph shows the number of students appeared and passed in class XI final exams in a school in different years.

In which year the pass percentage is the highest?
[pass percentage =(No. of students passed/Number of students appeared in exam)× 100]
Study the following graph to answer the question.

India’s exports to which of the following regions increased most in terms of percentage between 2000-01 and 2010 – 2011?
The given bar graph represents both, theoretical and practical readings obtained in 5 rounds of readings while conducting a scientific experiment.
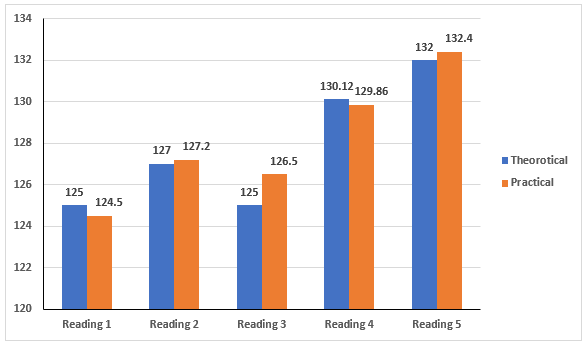
What is the ratio of the difference obtained in readings 2 and 5 when calculated theoretically to the difference obtained in readings 1 and 3 when readings were taken practically?
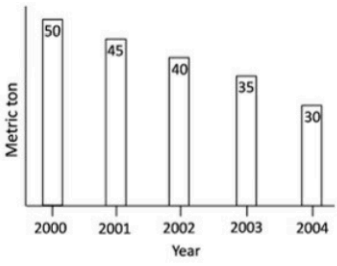
Wheat production of a country over a number of years is shown in the graph. Which year recorded the highest percent reduction in production over the previous year?
The following bar graph shows the sales (in thousands) of magazines from six branches (A, B, C, D, E and F) of a publishing company during two consecutive years 2021 and 2022.
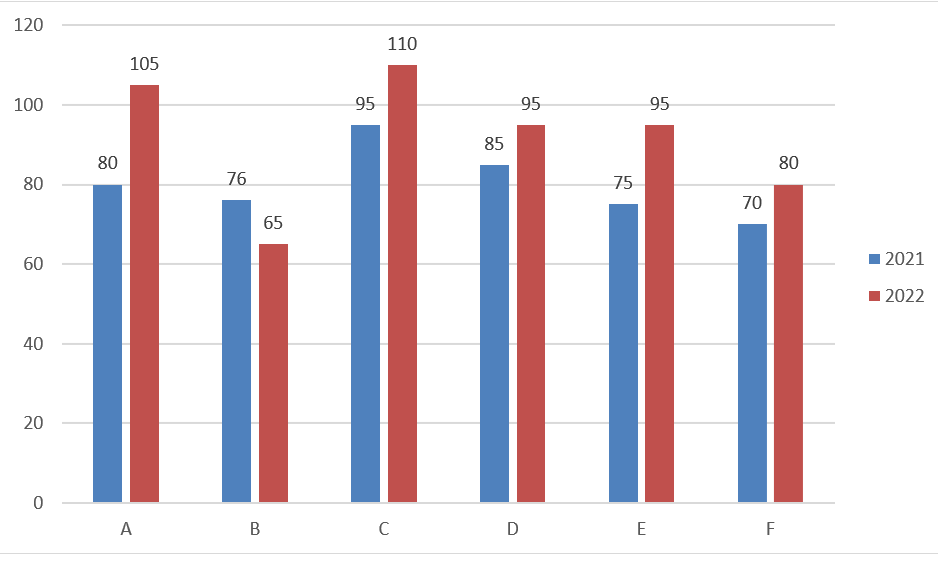
What percentage of the total sales of branch C for both years is the total sales of branch F for both years? (round your answer up to two decimal places)
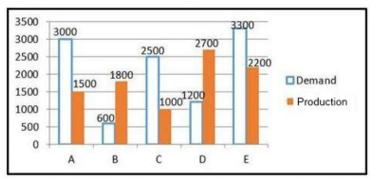
The following bar graph indicates the demand and production (in hundreds) of 5 companies A, B, C, D and E. X-axis indicates the demand and production (in hundreds) and Y-axis indicates the companies. Study the bar graph carefully and answer the question that follows.
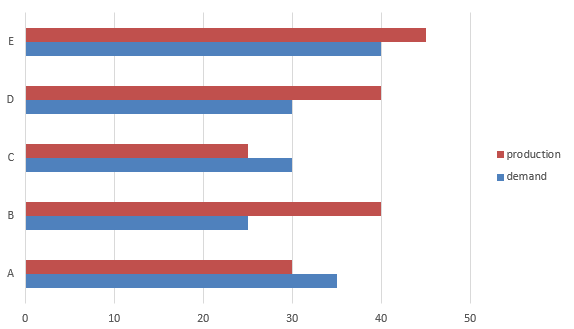
Find the difference between the average demand and average production of the five companies taken together.
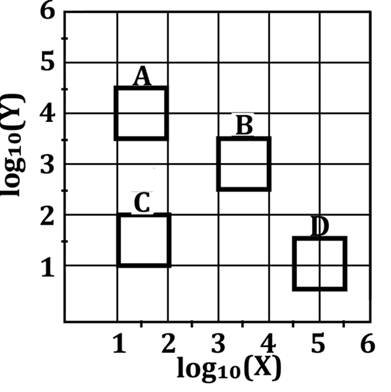
Which of the quadrilaterals would have the largest area when plotted in the X-Y plane?

Suggested Test Series

Suggested Test Series