arrow
arrow
arrow
In a class of 84 students, 29 failed in Science (S), 43 failed in Maths (M) and 17 students passed in both. Which of the following Venn diagrams is th
Question

In a class of 84 students, 29 failed in Science (S), 43 failed in Maths (M) and 17 students passed in both. Which of the following Venn diagrams is the correct depiction of the situation?

A.


B.


C.


D.


Correct option is D


Concept:
n(A ∪ B) = n(A) + n(B) - n(A ∩ B)
Solution:
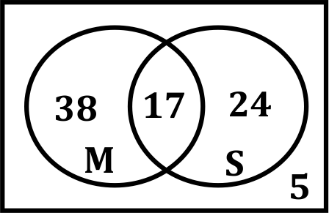
Given in a class of 84 students, 29 failed in Science (S), 43 failed in Maths (M) and 17 students passed in both.
Total number of students who failed in either maths or science is 84 - 17 = 67
⇒ n(M ∪ S) = 67.
We know that
n(M ∪ S) = n(M) + n(S) - n(M ∩ S)
⇒ 67 = 43 + 29 - n(M ∩ S)
⇒ n(M ∩ S) = 72 - 67
⇒ n(M ∩ S) = 5
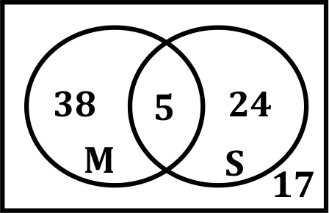
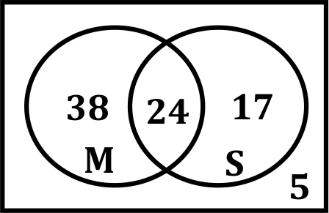
∴ Students who failed in only Science = 29 - 5 = 24.
Students who failed in only maths = 43 - 5 = 38.
Required venn diagram is:
 

Similar Questions

test-prime-package

Access ‘CSIR NET- GENERAL APTITUDE’ Mock Tests with

  • 60000+ Mocks and Previous Year Papers
  • Unlimited Re-Attempts
  • Personalised Report Card
  • 500% Refund on Final Selection
  • Largest Community
students-icon
354k+ students have already unlocked exclusive benefits with Test Prime!
Our Plans
Monthsup-arrow