Correct option is A
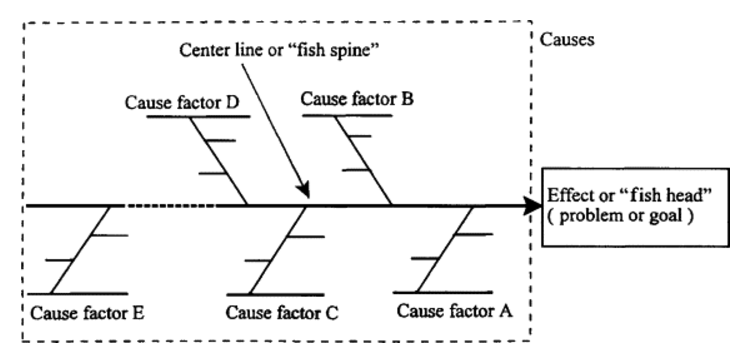
The Fishbone diagram, also known as the Cause-and-effect diagram or Ishikawa diagram, is a tool used to identify, explore, and display the possible causes of a specific problem or effect. It helps in brainstorming potential causes of issues in processes and is commonly used in quality control and problem-solving.
The diagram is called "fishbone" due to its resemblance to the skeleton of a fish, with the main "spine" representing the problem or effect, and the "bones" representing the various categories of causes.