Correct option is C
Given:
From State B:

Formula:
Solution:
Answer: (C) VI


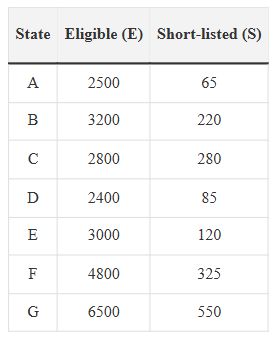
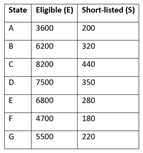
Directions : Study the following table carefully and answer the questions which follow :
Number of Candidates found Eligible and the Number of Candidates Short-listed for Interviews for a recent Recruitment Process for Six Posts from Different States.
Post | I | II | III | IV | V | VI | ||||||
State | E | S | E | S | E | S | E | S | E | S | E | S |
A | 2500 | 65 | 7200 | 240 | 5200 | 76 | 3600 | 200 | 4600 | 110 | 5400 | 380 |
B | 3200 | 220 | 8500 | 420 | 8400 | 190 | 6200 | 320 | 5800 | 180 | 6200 | 430 |
C | 2800 | 280 | 4500 | 350 | 7600 | 160 | 8200 | 440 | 7300 | 310 | 3700 | 250 |
D | 2400 | 85 | 4800 | 200 | 2600 | 55 | 7500 | 350 | 3900 | 160 | 4800 | 360 |
E | 3000 | 120 | 5600 | 280 | 3800 | 75 | 6800 | 280 | 6100 | 260 | 7800 | 520 |
F | 4800 | 325 | 6400 | 320 | 4400 | 220 | 4700 | 180 | 4900 | 220 | 8800 | 640 |
G | 6500 | 550 | 7000 | 140 | 6000 | 325 | 5500 | 220 | 8100 | 410 | 2700 | 200 |
E – Eligible S - Short-Listed | ||||||||||||
From State 'B', which post had the highest percentage of candidates short-listed?
Given:
From State B:
Formula:
Solution:
Answer: (C) VI
Given:
Eligible candidates for Post III from all states:
A: 5200
B: 8400
C: 7600
D: 2600
E: 3800
F: 4400
G: 6000
Formula:
Solution:
Sum = 5200 + 8400 + 7600 + 2600 + 3800 + 4400 + 6000 = 38,000
Number of states = 7
Approximate average ≈ 5500
Answer: (D) 5500
Given:
We are asked to calculate the percentage for Post I, using the values from all states.
From the table:
Formula:
Solution:
Given:
We are to find the ratio of total short-listed candidates from:
Step 1: Extract Short-listed (S) values
State E:
State G:
Step 2: Ratio
Final Answer:
307:369
Total number of candidates found eligible from all States together for Post I is approximately what percent of the total number of candidates found eligible from all States together for Post VI?
Solution:
Step 1: Extract eligible candidates
Post I (Eligible - E):
Total for Post I = 2500+3200+2800+2400+3000+4800+6500 = 25200
Post VI (Eligible - E):
Total Eligible for Post VI = 5400 + 6200 + 3700 + 4800 + 7800 + 8800 + 2700 = 39400
Given: Extract data for Post IV (Eligible and Short-listed)
Solution: Calculate percentage for each state
Given:
Post V (S):
A: 110
B: 180
C: 310
D: 160
E: 260
F: 220
G: 410
Post VI (S):
A: 380
B: 430
C: 250
D: 360
E: 520
F: 640
G: 200
Solution:
 English
 100 Questions
 200 Marks
 60 Mins English English25 Questions50 Marks15 Mins English English100 Questions200 Marks60 Mins English
 Year | Company P | Company Q |
2003 | 110 | 106 |
2004 | 130 | 140 |
2005 | 118 | 110 |
2006 | 200 | 190 |
2007 | 240 | 275 |
Study the table and answer the given question.
Number of students admitted in 5 different schools during 5 given years :
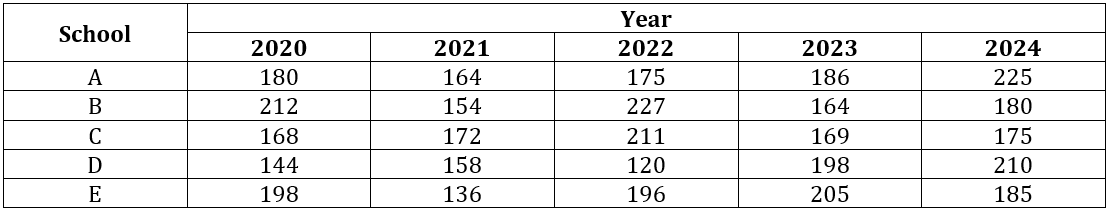
The average number of students admitted in schools B, C, D and E in 2021 is :
Read the following graph and answer the question :
Number of computers sold by dealers A, B, C and D in the years 2022 and 2023.
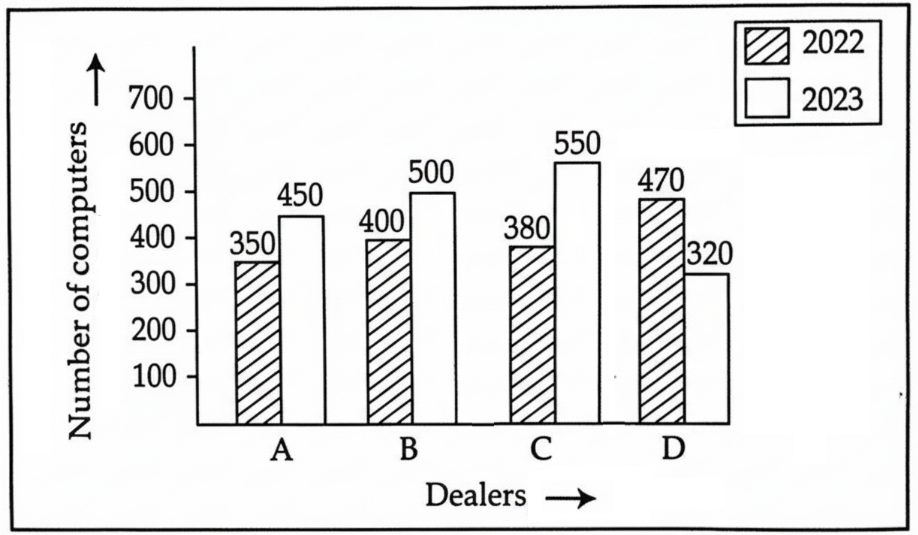
The average number of computers sold by dealers B and D in 2023 is what percent more than the average number of computers sold by dealers A, C and D in 2022 ?
Study the table and answer the given question.
Number of students admitted in 5 different schools during 5 given years :
If 40% of the total number of students admitted in schools A, B and C together in 2024 are boys, then the total number of girls admitted in schools A, B and C together in 2024 is :
Marks of two students, Simi and Shally in a unit test out of 50 are given. Based on this table, which of the following statements is wrong?
| Subject | Marks of Simi | Marks of Shally |
| English | 30 | 35 |
| Hindi | 45 | 42 |
| Mathematics | 48 | 50 |
| Science | 38 | 38 |
| Social Science | 25 | 40 |
Refer the table to answer the question.
SALE OF CARS (IN LAKH) | YEAR 2009 | YEAR 2010 | YEAR 2011 |
MARUTI | 1.25 | 1.8 | 1.95 |
HONDA | 1.3 | 4.2 | 5.5 |
HYUNDAI | 1.55 | 1.35 | 2.3 |
Which of the company has highest average sales of car during the period 2009-11?
Table – Weekly Fuel Usage (lines)
Vehicle | Mon | Tue | Wed | Thu | Fri |
Truck1 | 18 | 20 | 22 | 21 | 19 |
Truck 2 | 25 | 24 | 26 | 23 | 24 |
What is the overall average daily fuel usage for both trucks?
Table – Monthly Sales (in ₹1000)
Salesperson | Jan | Feb | Mar | Apr |
P | 50 | 60 | 70 | 55 |
Q | 65 | 68 | 62 | 64 |
What are the average monthly sales of Q?
Study the table and answer the question.
Number of New admission and number of TC issued in four schools M, N, O and P in different years are given in the table.
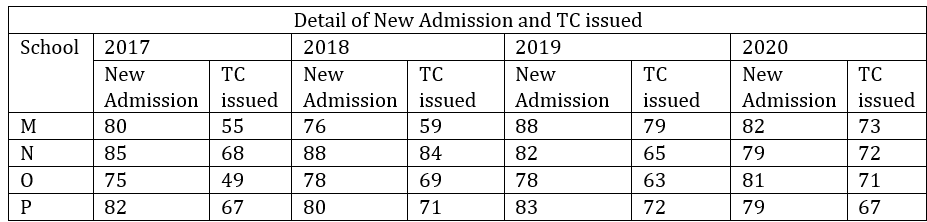
During 2018 to 2020, which school has saw the maximum increase in the number of students?
The given table shows the number of employees employed by different organizations in the given years.
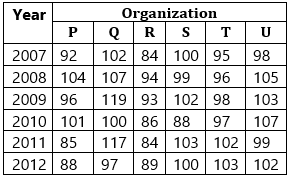
What is the respective ratio of the total number of employees employed by organization U in the years 2010 and 2012 to the total number of employees employed by organization P in the same years respectively?

Suggested Test Series

Suggested Test Series