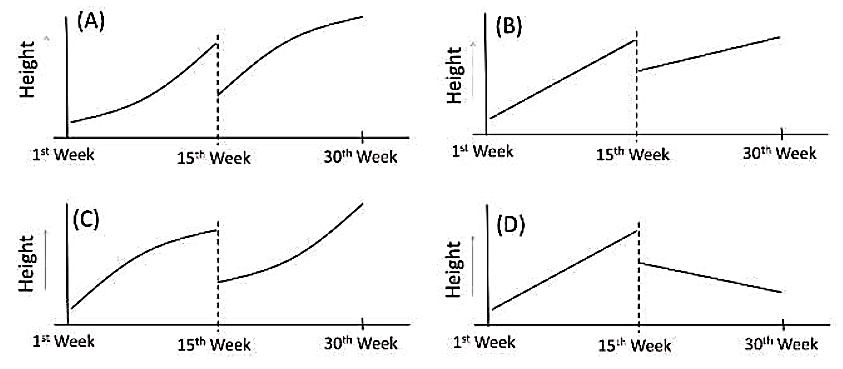
Correct option is A
Solution:
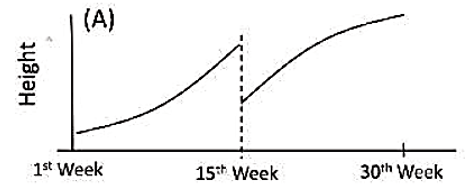
The problem describes how a tree's height changes over 30 weeks:
First 15 weeks:
- The growth rate increases linearly, meaning the tree grows at an accelerating pace.
- This suggests a curved upward pattern in the graph.
At the 15th week:
- The tree is trimmed down, causing a sudden drop in height.
After trimming (next 15 weeks):
- The tree continues growing, but the growth rate again increases linearly, meaning it starts slow and picks up speed gradually.
Step-by-Step Analysis of the Graphs:
Graph (A):
- First 15 weeks: Shows accelerating growth (curved upward).
- At 15 weeks: A sudden drop in height due to trimming.
- Next 15 weeks: Growth resumes with an increasing rate (curved upward).
- Correct representation of the tree’s growth.
Graph (B):
- Shows a steady growth rate after trimming, but does not show an increasing rate afterward.
Graph (C):
- Shows the correct initial acceleration and trimming, but the second phase does not show accelerating growth correctly.
Graph (D):
- Shows a decreasing growth rate after trimming, which is incorrect.
Final Answer: (a) A