Correct option is B
Analysis of Octad Patterns
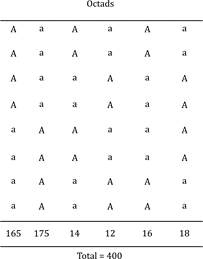
To determine when segregation occurred, we need to classify each pattern as FDS (Anaphase I) or SDS (Anaphase II). In Neurospora, each of the four meiotic products undergoes one mitotic division, producing two identical spores. Thus, the octad is composed of four pairs of identical spores, with pairs typically corresponding to spores 1-2, 3-4, 5-6, and 7-8 being from the same meiotic product.
- Patterns 1 and 2:
- Pattern 1 (A, A, A, A, a, a, a, a): Grouping into pairs, we get (A,A), (A,A), (a,a), (a,a), meaning meiotic products are A, A, a, a. This is consistent with FDS, where two meiotic products have A and two have a, arranged such that the alleles are separated into two groups of four spores each.
- Pattern 2 (a, a, a, a, A, A, A, A): Similarly, (a,a), (a,a), (A,A), (A,A), meiotic products a, a, A, A, again FDS.
- Both patterns show clear separation, indicative of Anaphase I segregation.
- Patterns 3 and 4:
- Pattern 3 (A, A, a, a, A, A, a, a): Pairs are (A,A), (a,a), (A,A), (a,a), meiotic products A, a, A, a. This shows alternating alleles among meiotic products, which is not typical for FDS. This pattern suggests SDS, where segregation occurred at Anaphase II, possibly due to crossing over.
- Pattern 4 (a, a, A, A, a, a, A, A): Pairs are (a,a), (A,A), (a,a), (A,A), meiotic products a, A, a, A, again alternating, consistent with SDS.
- Patterns 5 and 6:
- Pattern 5 (A, a, A, a, A, a, A, a): This pattern presents a challenge. If we consider each letter as an individual spore, it implies spore 1 is A, spore 2 is a, which contradicts the expectation that spores 1 and 2 (from the same meiotic product) should be identical. This suggests a potential issue with notation. In standard Neurospora genetics, each pair should have identical genotypes (e.g., A,A or a,a). However, given the pattern, it seems to list individual spore genotypes with alternation, which might indicate a mixed segregation pattern typical of SDS, possibly due to gene conversion or other events.
- Pattern 6 (a, A, a, A, a, A, a, A): Similarly, (a,A), (a,A), (a,A), (a,A) if paired, but again, within each pair, the genotypes differ (a and A), which is biologically implausible for haploid spores from the same meiotic product. This suggests the pattern is meant to represent a sequence where each position is distinct, and it’s classified as SDS based on the mixed nature.
- Given the classification in the analysis, patterns 1 and 2 are FDS (Anaphase I), and patterns 3 to 6 are SDS (Anaphase II)
To find the percentage of meiocytes where segregation occurred at Anaphase II, we sum the number of octads for patterns 3 to 6:
- Pattern 3: 14
- Pattern 4: 12
- Pattern 5: 16
- Pattern 6: 18
- Total for SDS = 14 + 12 + 16 + 18 = 60
The total number of octads is 400. The percentage is calculated as:
Based on the analysis, the percentage of meiocytes in which segregation occurred at Anaphase II is 15.0%.