 The ratio of candidates who failed in atmost two subjects to the candidates who failed in atleast one subject is:
Correct option is C
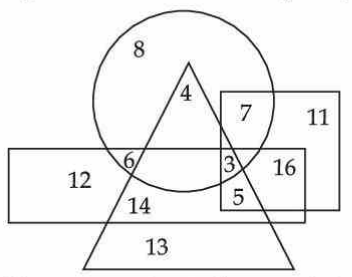
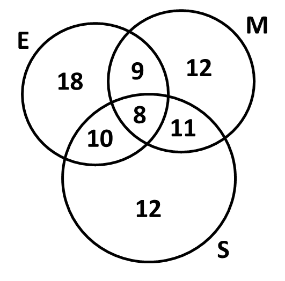
The Venn diagram shows the number of candidates who failed in different subjects: English (E), Math (M), and Science (S).
Calculating the Required Ratios
We need to find the ratio of candidates who failed in at most two subjects to the candidates who failed in at least one subject.
Candidates who failed in at most two subjects:
Candidates who failed in at least one subject:
Calculating the Ratio
Let's calculate the number of candidates in each category:
Therefore, the ratio of candidates who failed in at most two subjects to the candidates who failed in at least one subject is 72:80, which simplifies to 9:10.
Answer
The ratio of candidates who failed in at most two subjects to the candidates who failed in at least one subject is 9:10.
Conclusion
After rechecking, the original solution was correct.
- The overlapping regions represent the number of candidates who failed in multiple subjects.
- These are the candidates who failed in either one or two subjects, but not in all three.
- We can find this by adding the numbers in the regions that represent failing in one or two subjects.
- These are the candidates who failed in one, two, or all three subjects.
- We can find this by adding all the numbers in the Venn diagram.
- Candidates who failed in at most two subjects: 18 + 9 + 12 + 10 + 11 + 12 = 72
- Candidates who failed in at least one subject: 72 + 8 = 80
 English
 150 Questions
 150 Marks
 180 Mins