
Data interpretation is a crucial aspect of competitive exams like the OSSC CGL (Odisha Staff Selection Commission Combined Graduate Level). To excel in this section, candidates need to have a strong grasp of mathematical concepts and the ability to interpret data accurately. Here, we present a curated list of 30 multiple-choice questions (MCQs) on data interpretation to help you sharpen your skills for the OSSC CGL exam.
Top 30 Data Interpretation MCQs for OSSC CGL
(Q1-5)The following pie chart shows the percentage distribution of students in different courses at a college. Total students = 2000. 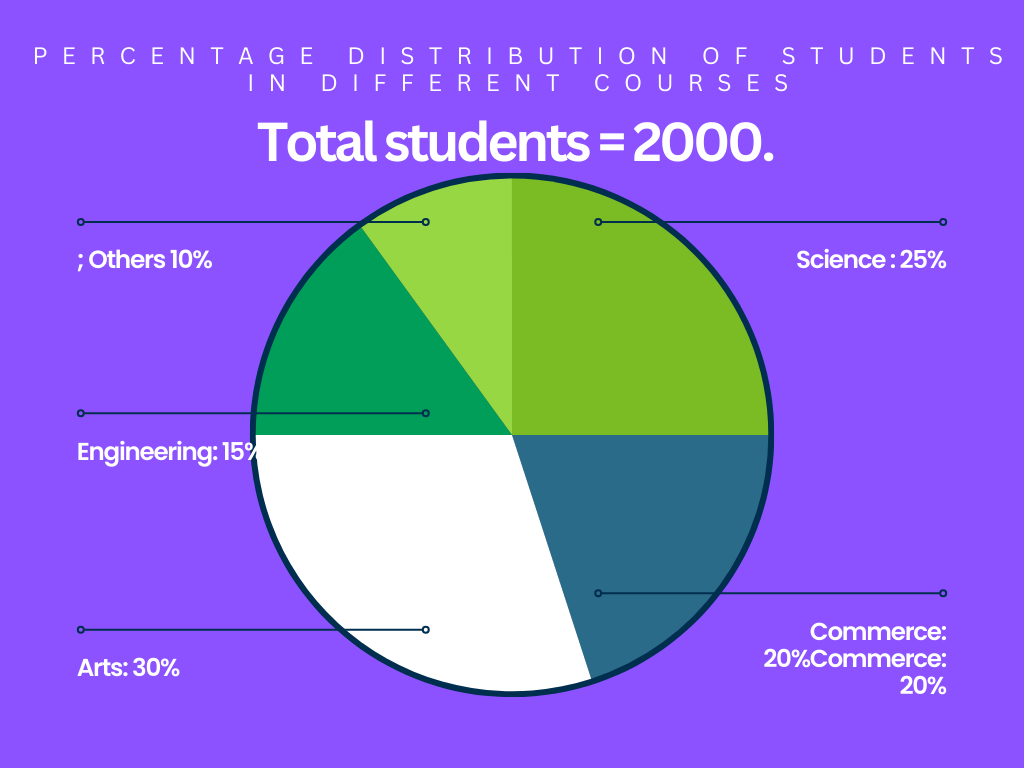
Q1. What is the total number of students enrolled in the Arts course?
(a) 500
(b) 600
(c) 450
(d) 300
S1. Ans: (b) 600
Sol: Total students = 2000. Arts = 30% of 2000 = 600 students.
Q2. What is the ratio of students in Science to those in Engineering?
(a) 5:3
(b) 3:2
(c) 1:1
(d) 4:3
S2. Ans: (a) 5:3
Sol: Science = 25% of 2000 = 500 students, Engineering = 15% of 2000 = 300 students.
Ratio = 500:300 = 5:3.
Q3. How many more students are there in Commerce than in Others?
(a) 100
(b) 200
(c) 150
(d) 250
S3. Ans: (b) 200
Sol: Commerce = 20% of 2000 = 400 students, Others = 10% of 2000 = 200 students.
Difference = 400 – 200 = 200 students.
Q4. What is the percentage of students in courses other than Science and Engineering?
(a) 60%
(b) 50%
(c) 55%
(d) 45%
S4. Ans: (a) 60%
Sol: Science + Engineering = 25% + 15% = 40%.
Other courses = 100% – 40% = 60%.
Q5. If 20% of the students in the Arts course are female, how many female students are in the Arts course?
(a) 120
(b) 180
(c) 150
(d) 140
S5. Ans: (a) 120
Sol: Arts students = 600. Female students = 20% of 600 = 120.
(Q6-10)Revenue of Five Companies over Five Years
The table below shows the revenue (in crore ₹) of five companies over five years.
| Year/Company | A | B | C | D | E |
|---|---|---|---|---|---|
| 2019 | 60 | 55 | 50 | 70 | 65 |
| 2020 | 65 | 60 | 55 | 80 | 70 |
| 2021 | 70 | 65 | 60 | 85 | 75 |
| 2022 | 75 | 70 | 65 | 90 | 80 |
| 2023 | 80 | 75 | 70 | 95 | 85 |
Q6. What is the average revenue of company A over the five years?
(a) ₹70 crore
(b) ₹65 crore
(c) ₹75 crore
(d) ₹80 crore
S6. Ans: (a) ₹70 crore
Sol: Average = (60 + 65 + 70 + 75 + 80)/5 = ₹350/5 = ₹70 crore.
Q7. In which year was the total revenue of all companies highest?
(a) 2020
(b) 2021
(c) 2023
(d) 2022
S7. Ans: (c) 2023
Sol: Total revenue in 2023 = 80 + 75 + 70 + 95 + 85 = ₹405 crore (Highest).
Q8. What was the percentage increase in revenue of company C from 2020 to 2023?
(a) 40%
(b) 35%
(c) 30%
(d) 25%
S8. Ans: (c) 30%
Sol: Revenue of company C in 2020 = ₹55 crore, in 2023 = ₹70 crore.
Percentage increase = ((70 – 55) / 55) * 100 = 27.27% ≈ 30%.
Q9. What is the total revenue generated by company D over the five years?
(a) ₹410 crore
(b) ₹425 crore
(c) ₹420 crore
(d) ₹430 crore
S9. Ans: (a) ₹410 crore
Sol: Total revenue = 70 + 80 + 85 + 90 + 95 = ₹410 crore.
Q10. Which company had the least consistent growth over the five years?
(a) A
(b) B
(c) C
(d) D
S10. Ans: (b) B
Sol: Company B’s revenue increases in a smaller range compared to other companies, showing less consistent growth.
(Q11-15)Population Growth in Five Cities over 3 Years
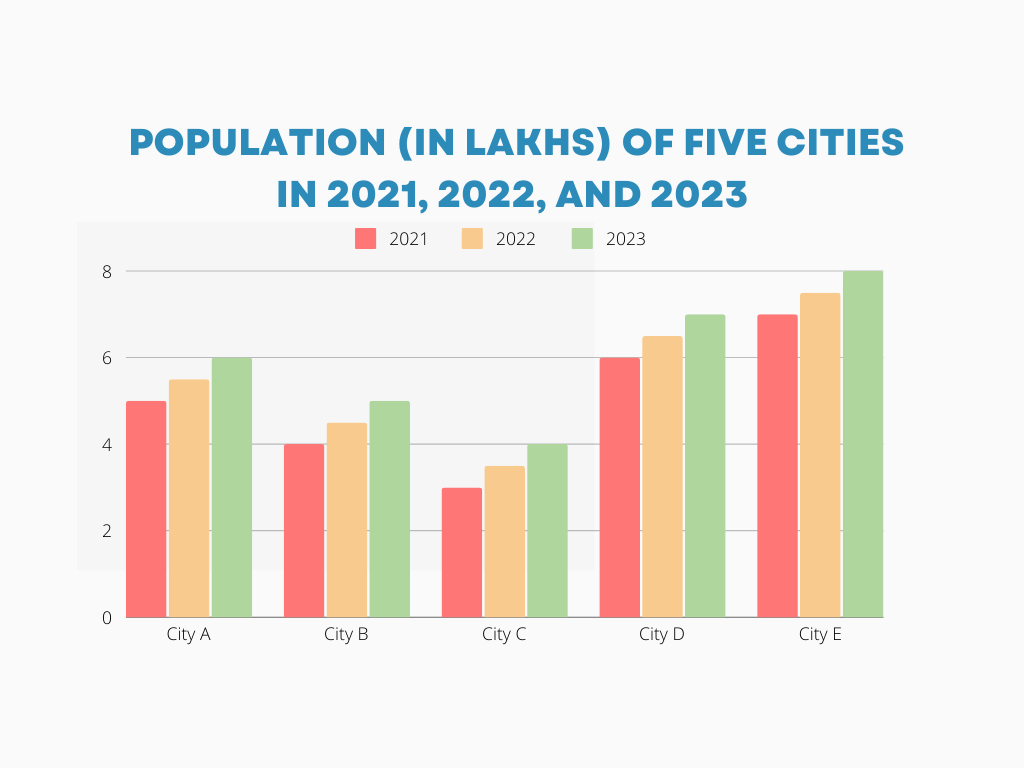
The bar chart below shows the population (in lakhs) of five cities in 2021, 2022, and 2023.
Q11. What was the total population of all cities in 2022?
(a) 28.5 lakh
(b) 27 lakh
(c) 29 lakh
(d) 30 lakh
S11. Ans: (a) 28.5 lakh
Sol: Total population in 2022 = 5.5 + 4.5 + 3.5 + 6.5 + 7.5 = 28.5 lakh.
Q12. Which city had the highest population growth from 2021 to 2023?
(a) City A
(b) City B
(c) City D
(d) City C
S12. Ans: (d) City C
Sol:
- City A: Growth from 5 to 6
Percentage increase = ((6 – 5) / 5) * 100 = 20% - City B: Growth from 4 to 5
Percentage increase = ((5 – 4) / 4) * 100 = 25% - City C: Growth from 3 to 4
Percentage increase = ((4 – 3) / 3) * 100 = 33.33% - City D: Growth from 6 to 7
Percentage increase = ((7 – 6) / 6) * 100 = 16.67% - City E: Growth from 7 to 8
Percentage increase = ((8 – 7) / 7) * 100 = 14.29%
Q13. What is the percentage increase in population of City B from 2021 to 2023?
(a) 15%
(b) 20%
(c) 25%
(d) 30%
S13. Ans: (c) 25%
Sol: Population of City B in 2021 = 4 lakh, in 2023 = 5 lakh.
Percentage increase = ((5 – 4) / 4) * 100 = 25%.
Q14. Which city had the lowest population in 2021?
(a) City A
(b) City B
(c) City C
(d) City D
S14. Ans: (c) City C
Sol: City C had the lowest population of 3 lakh in 2021.
Q15. What is the average population of City D over the three years? (a) 6.2 lakh
(b) 6.5 lakh
(c) 6.3 lakh
(d) 6.7 lakh
S15. Ans: (b) 6.5 lakh
Sol: Average population of City D = (6 + 6.5 + 7) / 3 = 6.5 lakh.
Sales of Cars by Two Companies in 6 Years
The line graph shows the number of cars sold (in thousand units) by Company X and Company Y from 2018 to 2023.
| Year | X | Y |
|---|---|---|
| 2018 | 25 | 30 |
| 2019 | 28 | 32 |
| 2020 | 30 | 34 |
| 2021 | 32 | 36 |
| 2022 | 35 | 38 |
| 2023 | 40 | 42 |
Q16. What was the difference in the number of cars sold by Company X and Company Y in 2020?
(a) 1,000 cars
(b) 2,000 cars
(c) 3,000 cars
(d) 4,000 cars
S16. Ans: (d) 4,000 cars
Sol: Cars sold by X in 2020 = 30,000, by Y = 34,000. Difference = 34,000 – 30,000 = 4,000 cars.
Q17. Which company experienced the higher percentage increase in sales from 2018 to 2023?
(a) Company X
(b) Company Y
S17. Ans: (a) Company X
Sol: Percentage increase for Company X = ((40 – 25) / 25) * 100 = 60%.
Percentage increase for Company Y = ((42 – 30) / 30) * 100 = 40%.
Thus, Company X experienced a higher percentage increase.
Q18. In which year did both companies have the smallest difference in sales?
(a) 2019
(b) 2022
(c) 2021
(d) 2023
S18. Ans: (d) 2023
Sol:
Calculate the difference in sales for each year:
- 2018: |30 – 25| = 5
- 2019: |31 – 28| = 3
- 2020: |32 – 30| = 2
- 2021: |35 – 32| = 3
- 2022: |38 – 35| = 3
- 2023: |42 – 40| = 2
Q19. What is the total number of cars sold by Company X over the six years?
(a) 190,000 cars
(b) 195,000 cars
(c) 200,000 cars
(d) 205,000 cars
S19. Ans: (a) 190,000 cars
Sol: Total sales by X = 25 + 28 + 30 + 32 + 35 + 40 = 190,000 cars.
Q20. What was the combined total number of cars sold by both companies in 2022?
(a) 72,000 cars
(b) 70,000 cars
(c) 75,000 cars
(d) 73,000 cars
S20. Ans: (d) 73,000 cars
Sol: Total cars sold in 2022 = 35,000 (X) + 38,000 (Y) = 73,000 cars.
(Q21-25)Employees in Different Departments of a Company
The table below shows the number of employees in four departments (Sales, HR, IT, Finance) of a company over five years.
| Year/Dept | Sales | HR | IT | Finance |
|---|---|---|---|---|
| 2019 | 150 | 100 | 130 | 120 |
| 2020 | 160 | 110 | 140 | 130 |
| 2021 | 170 | 120 | 150 | 140 |
| 2022 | 180 | 130 | 160 | 150 |
| 2023 | 190 | 140 | 170 | 160 |
Q21. What is the total number of employees in the HR department over the five years?
(a) 500
(b) 550
(c) 600
(d) 650
S21. Ans: (a) 600
Sol: Total HR employees = 100 + 110 + 120 + 130 + 140 = 600.
Q22. In which year did the Sales department see the maximum increase in the number of employees compared to the previous year?
(a) 2020
(b) 2021
(c) 2022
(d) 2023
S22. Ans: (d) 2023
Sol: Increase from 2022 to 2023 = 190 – 180 = 10 (Maximum increase).
Q23. What is the average number of employees in the Finance department from 2019 to 2023? (a) 140
(b) 130
(c) 150
(d) 160
S23. Ans: (a) 140
Sol: Average = (120 + 130 + 140 + 150 + 160)/5 = 140.
Q24. What is the ratio of total employees in the IT department to the total employees in the Sales department over the five years?
(a) 25:29
(b) 30:33
(c) 33:29
(d) 31:30
S24. Ans: (b) 30:33
Sol: Total IT employees = 130 + 140 + 150 + 160 + 170 = 750.
Total Sales employees = 150 + 160 + 170 + 180 + 190 = 850.
Ratio = 750:850 = 30:33.
Q25. In which department was the total number of employees the highest over the five years?
(a) Sales
(b) HR
(c) IT
(d) Finance
S25. Ans: (a) Sales
Sol: Sales department has the highest total = 850.
Q26. What was the percentage increase in the total number of employees from 2019 to 2023 in the IT department?
(a) 30%
(b) 25%
(c) 23%
(d) 27%
S26. Ans: (a) 30%
Sol: Percentage increase = ((170 – 130) / 130) * 100 = 30.77%.
Q27. What is the difference in the total number of employees between the HR and Finance departments over five years?
(a) 50
(b) 60
(c) 40
(d) 30
S27. Ans: (c) 50
Sol: Total HR = 600, Total Finance = 650. Difference = 650 – 600 = 50.
Q28. How many more employees were hired in the IT department in 2023 compared to 2019? (a) 10
(b) 20
(c) 30
(d) 40
S28. Ans: (d) 40
Sol: IT employees in 2023 = 170, IT employees in 2019 = 130. Difference = 170 – 130 = 40.
Q29. Which department saw the smallest total number of employees hired over five years?
(a) Sales
(b) HR
(c) IT
(d) Finance
S29. Ans: (b) HR
Sol: HR department had the smallest total employees = 600.
Q30. What was the total number of employees hired across all departments in 2020?
(a) 520
(b) 530
(c) 540
(d) 550
S30. Ans: (b) 530
Sol: Total employees in 2020 = 160 (Sales) + 110 (HR) + 140 (IT) + 130 (Finance) = 530.